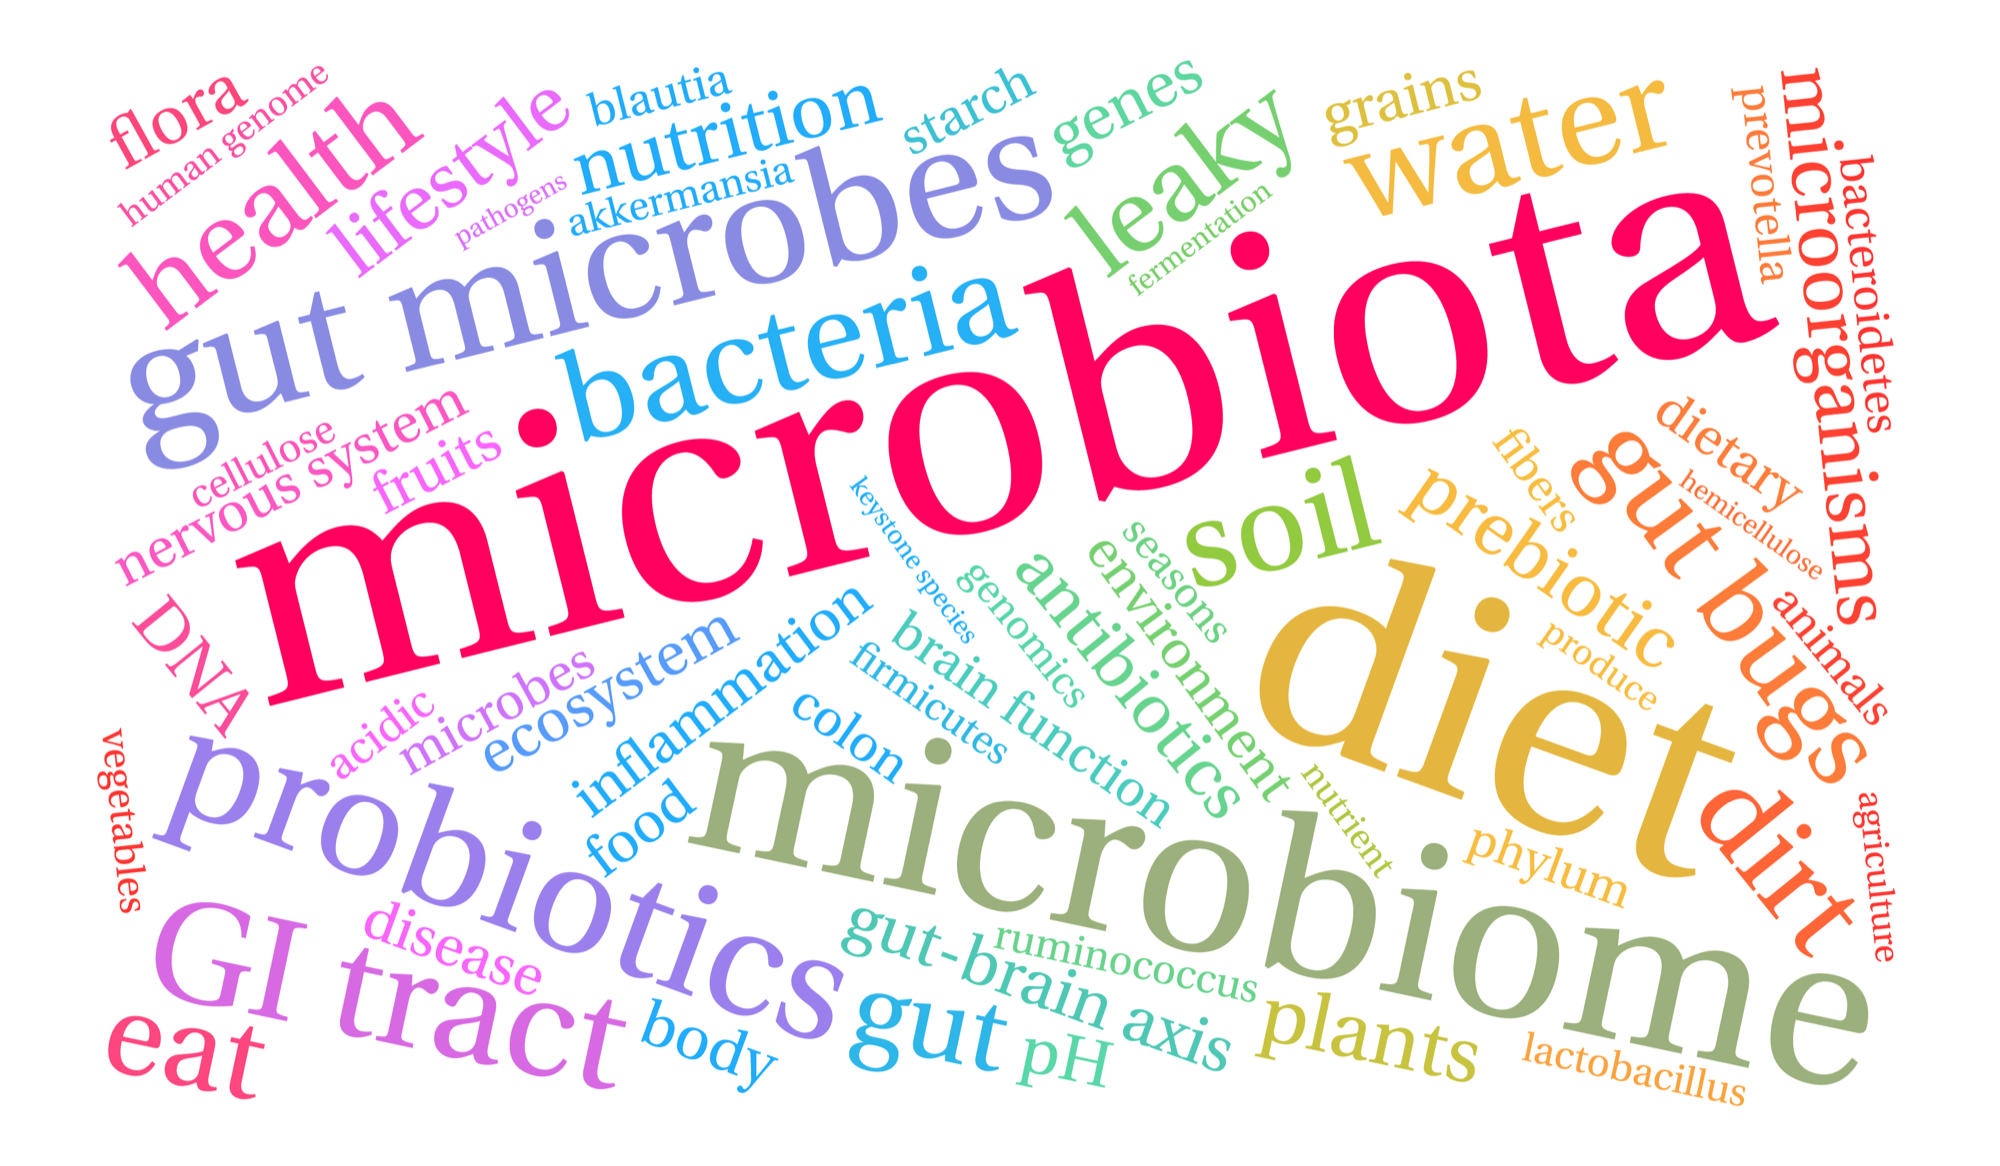
What is microbiome?
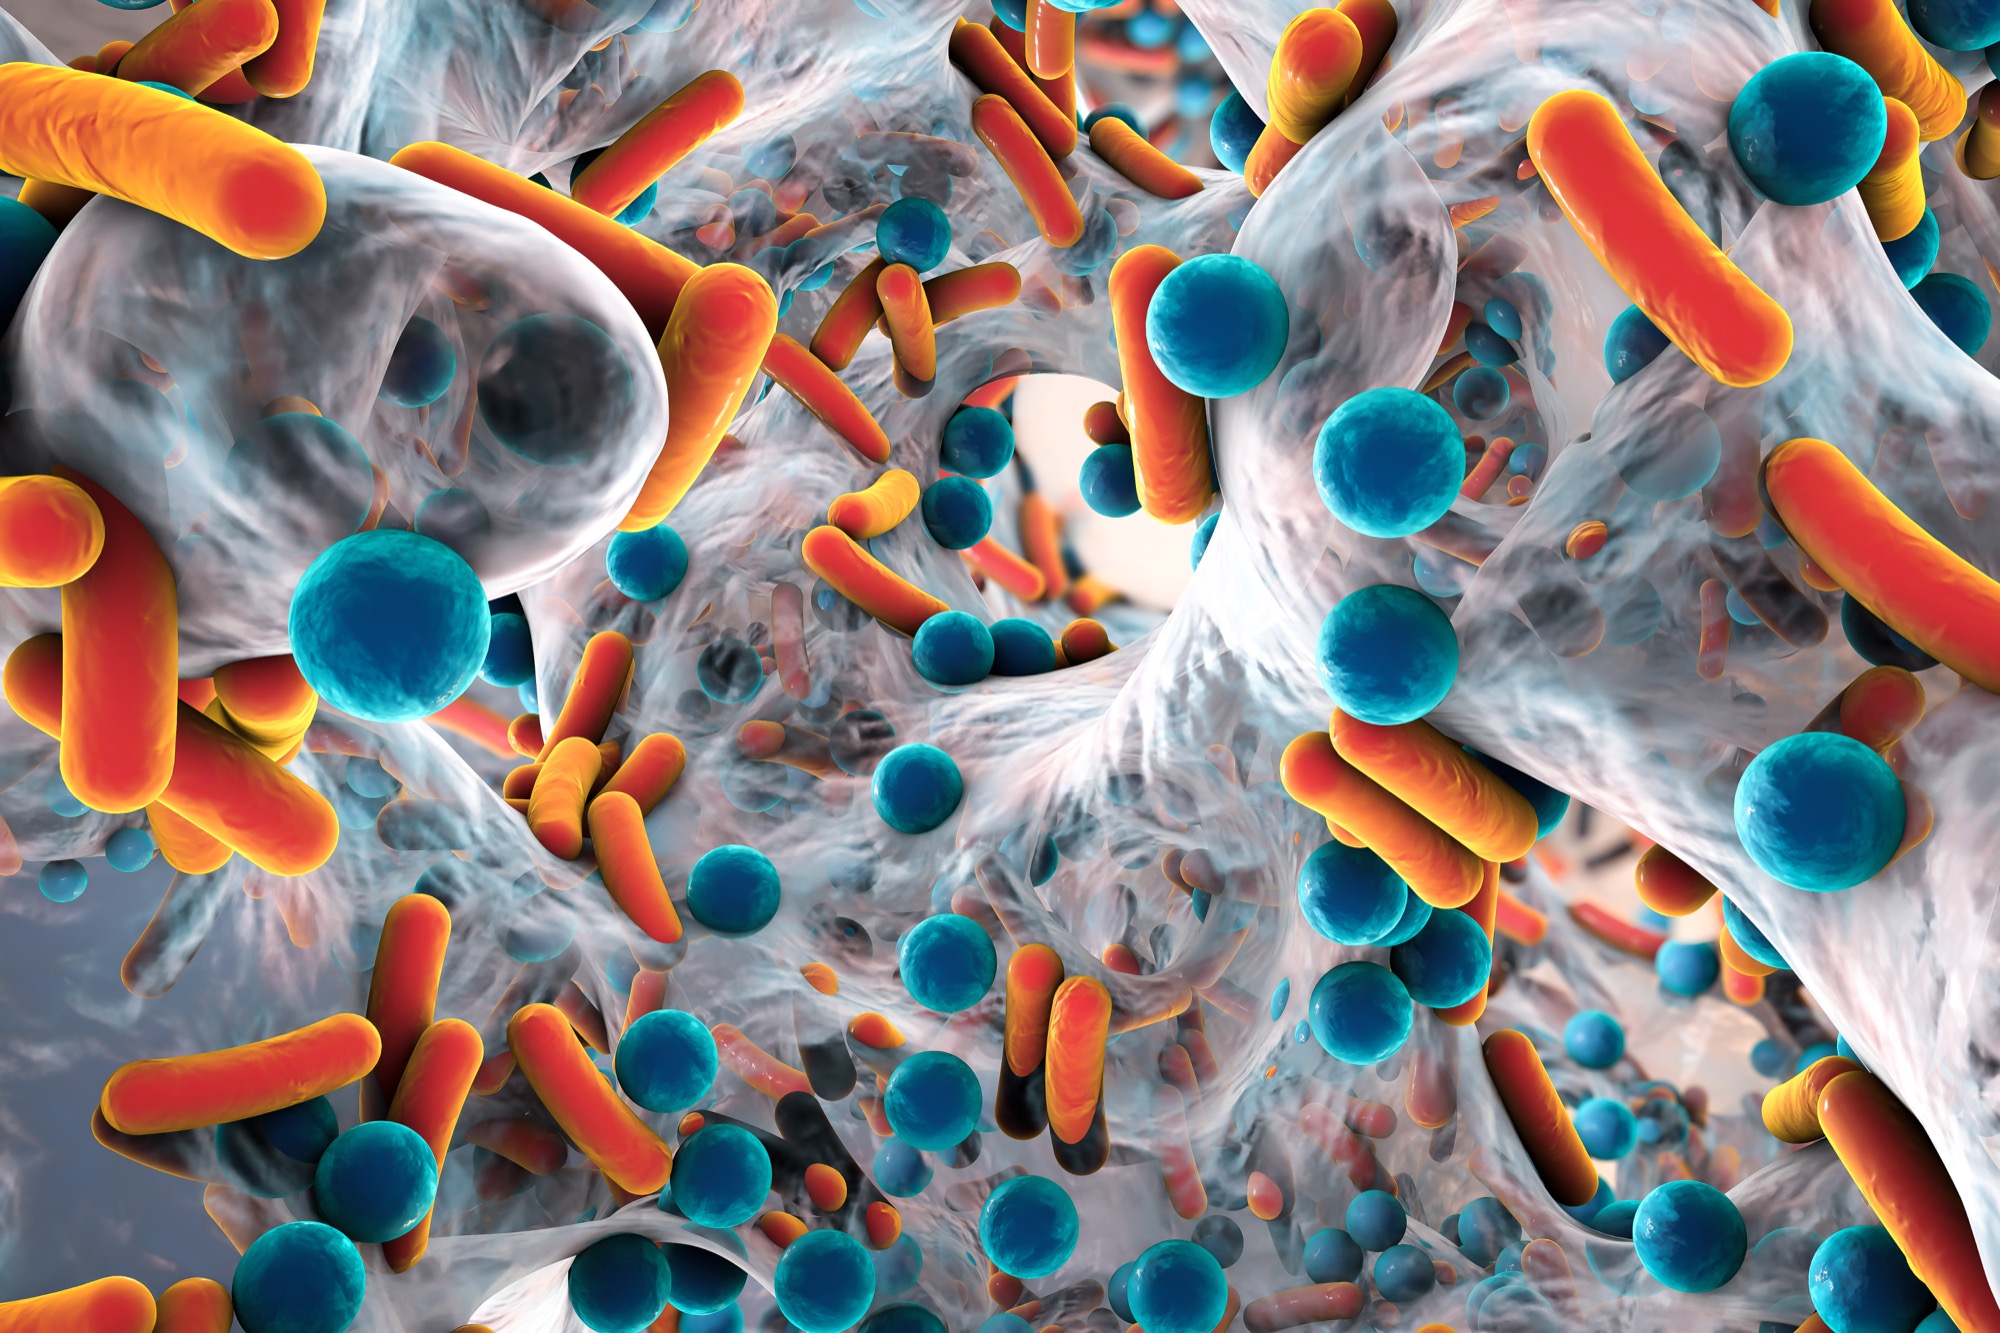
Microbiome refers to the study of all microorganisms including bacteria, archaea, fungi, yeast, and virus in an environment. Approximately 1% of microorganisms can be cultured in laboratories. Thus, microbiome research through NGS platform will provide the genetic material information of a microbial community in a given environment. The 16S ribosomal RNA (rRNA) sequencing is used for the characterization of microbial populations, while 18S rRNA is used for eukaryotes, and ITS region is specific to fungal genomes. These approaches can explore “who are they” and “how do they affect by their environment”. The alteration of microbial community probably affects health status in both humans and animals as well as in the environment.
The variable regions (V3-V4) of 16S rRNA gene are amplified using QIAseq 16S/ITS Region Panels from QIAGEN system to identify the microbial profiles in stool, soil, or water. This system uses phased primers in order to increase the quality scores of reads and also decrease background contamination in your samples. In addition, low amount of genomic DNA ranging from 1 pg to 1 ng can be amplified. The 16S amplicons are sequenced through paired-end illumina MiSeq platform (2 x 300 bp) of our company.
__________
Download Sample Sheet
___________
Data analysis
Quality profiles
- De-multiplexing: remove barcode sequences
- Trimming: remove the primer and adaptor sequences from V3-V4 amplicon reads
- Filtering: filter low-quality sequences of both forward and reverse reads, which are unexpected reads
- Denoising: remove sequence errors from amplicon reads
- Merging: assemble forward and reverse overlapping reads to generate one consensus sequence
- Non-chimeric: remove artifact chimeric reads
- Rarefaction analysis: estimate how many taxa are detected in the same size of reads
Alpha diversity (diversity within each sample)
- Observed species: measure the number of different taxa (richness)
- Chao1: estimate diversity based on bacterial abundance (richness)
- Shannon: estimate the proportion of individual taxa (evenness)
- Phylogenetic diversity whole tree: measure diversity based on phylogenetic difference
Beta diversity (difference of microbial community between samples)
- Principle coordinate analysis (PCoA): visualize dissimilarity of data by measurement of the phylogenetic distance between samples
- Non-metric multidimensional scaling (NMDS): visualize dissimilarity of data based on non-metric distances
Taxonomic profiles
- Bar chart: display microbial compositions at different taxonomic levels
- Krona plot: show taxonomic classification in a pie chart
Linear discriminant analysis effect size (LEfSe) และ Cladogram
- Show significantly abundant taxonomy for identification of biomarkers
__________
Download 16S rRNA Report
___________